Netflix Content Analytics & Trend Analysis
Netflix Content Analytics & Trend Analysis is a data analytics project built with Python, Pandas, and Plotly to explore and visualize Netflix content trends. The project analyzes Movies vs TV Shows distribution, genre popularity, and seasonal release patterns using data cleaning, preprocessing, and exploratory data analysis techniques. It delivers interactive visualizations and business insights to help understand content strategy and audience trends over time.
- Client
- SMIT Mini Hackathon 2025
- Team Size
- 1 members
- Timeline
- Dec 2025 — Dec 2025
- Stack
- 5 technologies
The story
Overview
Netflix Content Analytics & Trend Analysis is a data analytics project designed to explore and visualize trends in Netflix’s content catalog using Python-based data science tools. Built with Pandas, NumPy, and Plotly, the project focuses on uncovering insights related to content distribution, genre popularity, release patterns, and seasonal trends across Movies and TV Shows.
The project demonstrates how raw entertainment dataset information can be transformed into meaningful business intelligence through data cleaning, preprocessing, exploratory data analysis (EDA), and interactive visualizations. It simulates a real-world media analytics scenario where streaming platforms analyze user content libraries to guide future production and acquisition strategies.
Unlike traditional dashboards or production systems, this project focuses on analytical exploration and insight generation, using Jupyter Notebook as the primary environment for iterative data analysis and visualization.
Problem Statement
Streaming platforms like Netflix manage vast content libraries that evolve continuously over time. Understanding patterns in content distribution is critical for making informed business decisions.
This project aims to answer key analytical questions:
- How has the distribution of Movies vs TV Shows changed over time?
- Which genres dominate Netflix’s content library?
- Are there seasonal patterns in content releases?
- What insights can guide future content investment strategies?
The goal is to transform raw dataset information into actionable insights through structured analysis and visualization.
Data Understanding
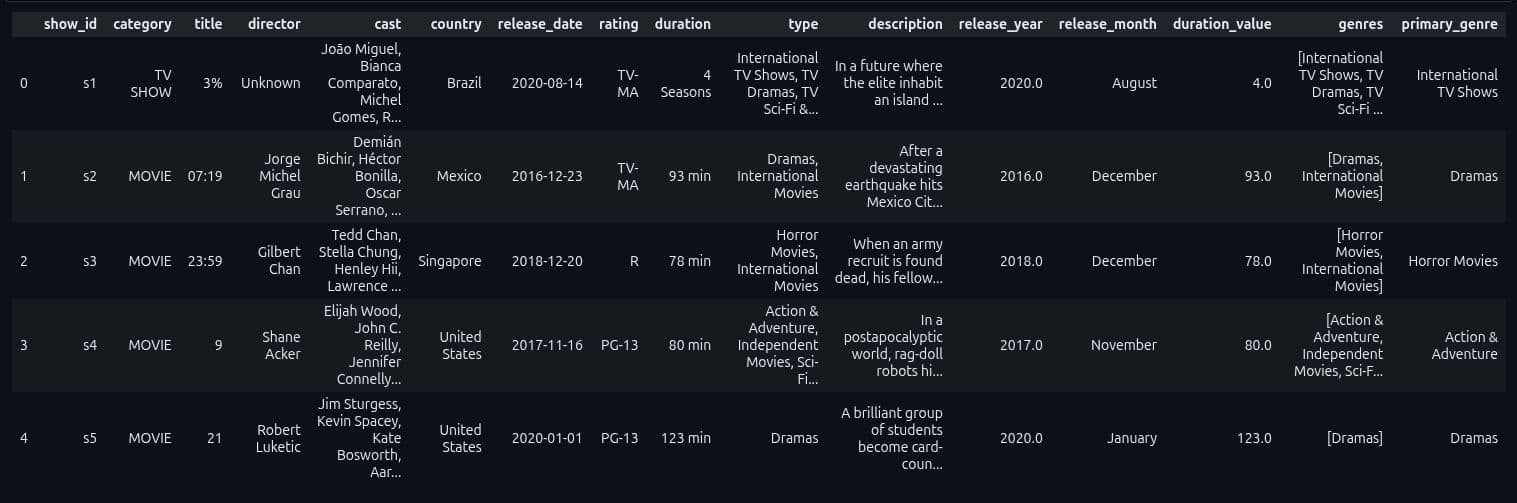
The dataset contains metadata of Netflix titles including movies and TV shows with attributes such as:
- show_id – Unique identifier
- category – Movie or TV Show
- title – Content title
- director – Director information
- cast – Main actors
- country – Production country
- release_date – Date added to Netflix
- rating – Content maturity rating
- duration – Runtime or number of seasons
- type – Genre categories
- description – Content summary
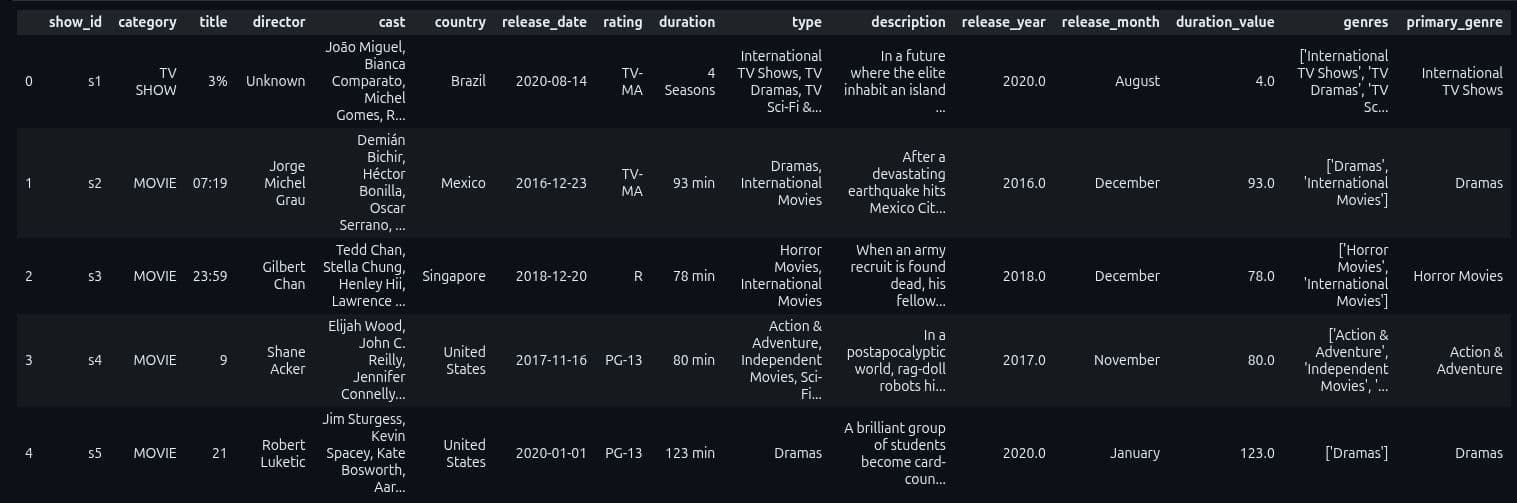
This dataset was cleaned and transformed to enable meaningful analysis and visualization.
Data Cleaning & Preprocessing
Several preprocessing steps were applied to ensure data quality and analytical readiness:
Data Cleaning Steps
- Standardized column names for consistency
- Handled missing values (e.g., replacing missing directors with "Unknown")
- Converted release_date into datetime format
- Extracted release_year and release_month features
- Cleaned and standardized duration values
- Removed duplicate records
- Processed multi-genre fields and extracted primary genres
The cleaned dataset was used for all downstream analysis and visualization tasks.
Exploratory Data Analysis (EDA)
Movies vs TV Shows Trend Analysis
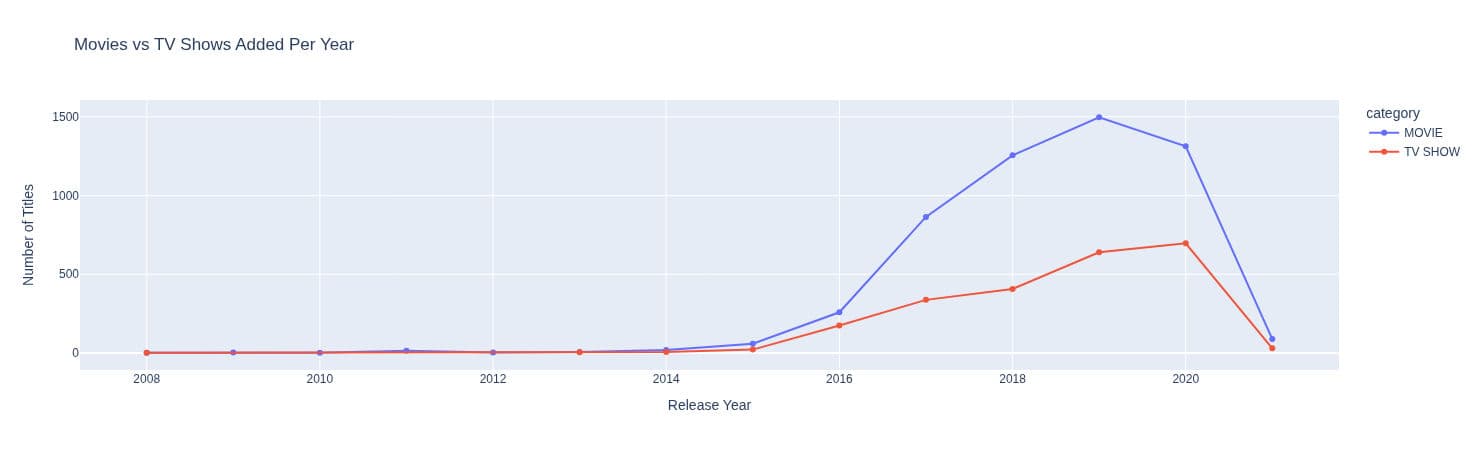
A time-series analysis was performed to understand how Netflix’s content strategy evolved over time.
- Line charts were used to compare Movies vs TV Shows additions per year
- Trends highlight the shift toward increasing investment in TV Shows in recent years
Genre Distribution Analysis
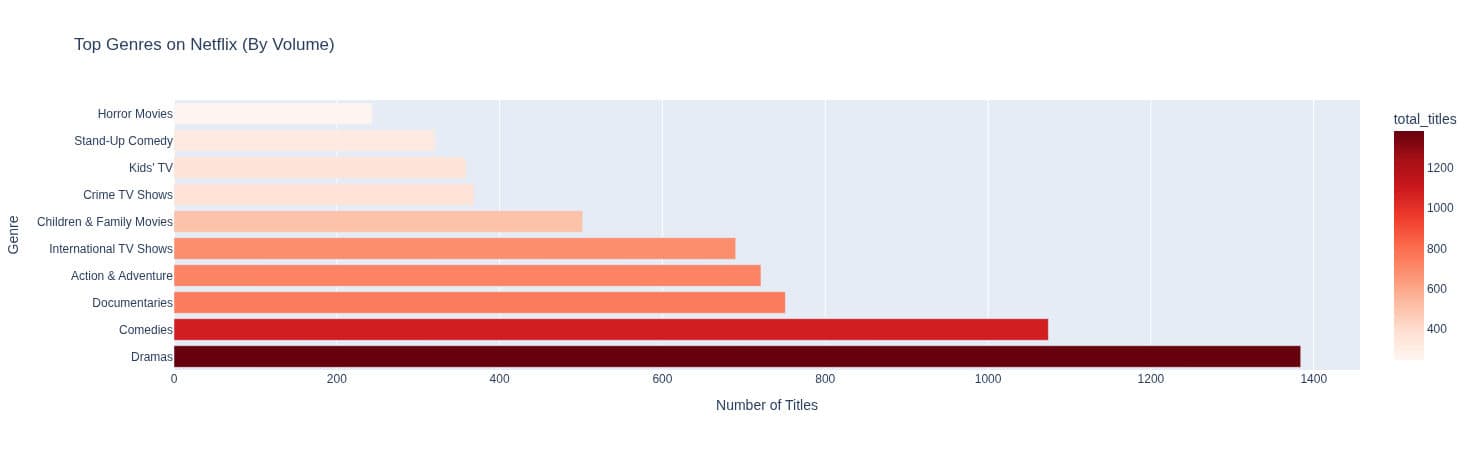
A genre-wise frequency analysis was conducted to identify dominant content categories.
- Horizontal bar charts were used to visualize top genres
- Insights reveal that a few genres dominate the catalog, indicating strong audience demand and content concentration
Seasonal Release Patterns
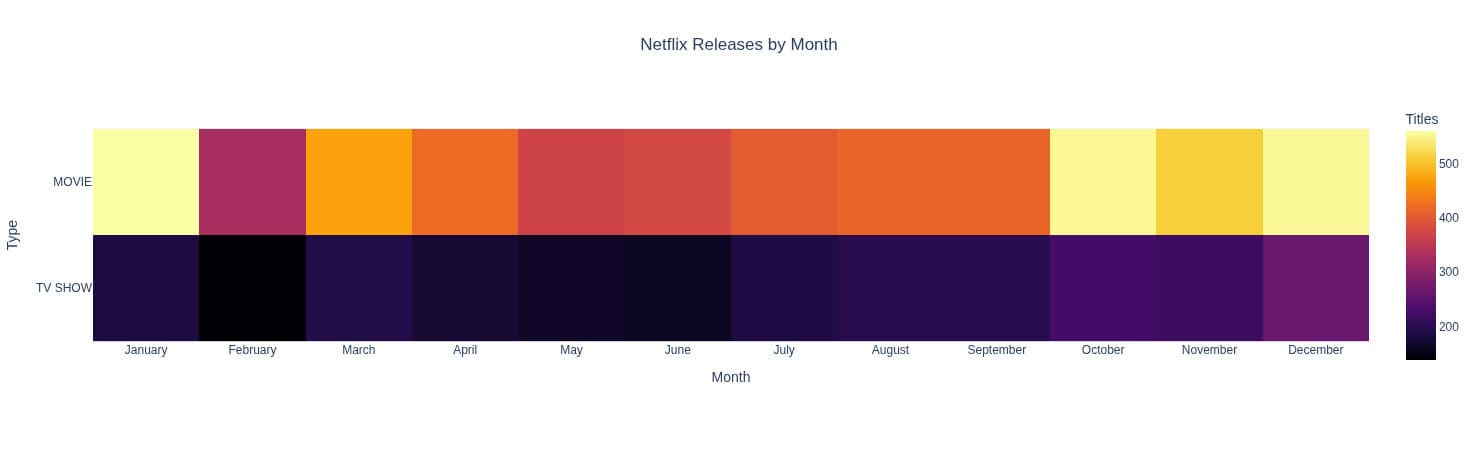
A heatmap was created to analyze monthly release trends across Movies and TV Shows.
- Clear seasonal spikes were observed in specific months
- Netflix appears to follow strategic content release cycles aligned with audience engagement patterns
Key Insights
From the analysis, several business-relevant insights were derived:
- TV Shows have shown consistent growth in recent years compared to Movies
- A small number of genres dominate Netflix’s content library
- Content releases follow clear seasonal patterns, with peak activity in certain months
- These patterns suggest strategic content planning based on user engagement trends
Tools & Technologies Used
Data Analysis
- Python 3.11
- Pandas
- NumPy
Visualization
- Plotly (interactive charts)
- Matplotlib (optional support)
Development Environment
- Jupyter Notebook
Project Workflow
The project followed a structured data analytics pipeline:
- Data collection and loading
- Data cleaning and preprocessing
- Feature engineering (year, month extraction)
- Exploratory data analysis (EDA)
- Data visualization using Plotly
- Insight generation and interpretation
Key Learnings
This project helped strengthen core data analytics skills including:
- Data cleaning and preprocessing techniques
- Handling missing and inconsistent data
- Feature engineering for time-based analysis
- Interactive visualization design using Plotly
- Translating raw data into business insights
- Understanding content strategy through data
Summary
Netflix Content Analytics & Trend Analysis demonstrates how data-driven approaches can uncover meaningful insights from large content datasets. By analyzing content distribution, genre trends, and seasonal patterns, the project provides a clear understanding of how streaming platforms structure and evolve their content libraries over time.